

Coffee Statistics: Consumption, Brewing, and Market Data (2026)
Key coffee statistics on U.S. daily drinking, brewing methods, and global market. Sourced survey data plus iCoffee house-recipe ratio and temperature charts.

Third-party survey and trade data, plus first-party brewing charts from the iCoffee house recipes.
66% of U.S. adults drank coffee in the past day in the Spring 2026 National Coffee Association survey, roughly 195 million American adults drink coffee each week, and global consumption is forecast at a record 173.9 million 60-kg bags in 2025/26 per the USDA. At home, drip brewers remain the most common preparation method among past-day drinkers (38%), while specialty coffee reached 48% of past-day drinkers in Fall 2025. Below: the strongest sourced coffee statistics on U.S. habits, brewing methods, prices, and the global market, plus first-party ratio and temperature charts from the published house recipes.
At iCoffee we publish tested house recipes and build a brewing app for logging what you dial in at home. We pulled together the industry's key coffee statistics on U.S. drinking habits, brewing methods, prices, and global supply. Every number links to whoever published it. We checked every number against its source in July 2026.
How big is the global coffee market?
Global supply and demand figures below come from the USDA Foreign Agricultural Service December 2025 coffee circular. Trade bodies count coffee in 60-kg sacks (roughly 132 pounds each, several thousand cups' worth). Bag counts are on a 2025/26 marketing-year basis. These are forecasts, revised semi-annually, not final harvest tallies.
- Production: World output is forecast at a record 178.8 million bags for 2025/26, up 3.5 million bags year on year, driven by recovery in Vietnam and record crops in Indonesia and Ethiopia.
- Consumption: Global use is forecast at a record 173.9 million bags, with ending stocks expected to fall for a fifth consecutive year to 20.1 million bags.
Brazil remains the dominant origin in the USDA forecast at 63.0 million bags (38.0M arabica, 25.0M robusta). That is a USDA figure, not Brazil's own Conab estimate; do not mix the two series.
On the trade side, Cecafé reports Brazil exported a calendar-year record of 50.44 million bags in 2024, up 28.5% versus 2023.
The International Coffee Organization tracks monthly trade flows. In April 2026, exports of all forms of coffee (green, soluble, and roasted, expressed in green-bean equivalent bags) fell 0.9% to 12.05 million bags.
The ICO Composite Indicator Price (I-CIP) averaged 256.05 U.S. cents per pound in May 2026, down 3.8% from April, per the ICO Coffee Market Report May 2026. That is a nominal monthly average across arabica and robusta groups, not a spot price for a single origin. The May reading sits in a declining 2026 trend as expectations of ample supply strengthened, per the ICO report.
U.S. economic footprint and branded cafés
Domestically, a 2023 NCA economic impact study (Technomic, on 2022 data) sizes U.S. coffee at $343.2 billion in total economic impact (direct, indirect, and induced), up 52.4% since 2015. The same study credits coffee with more than 2.2 million U.S. jobs and more than $100 billion in annual wages.
Retail concentration is tracked separately. World Coffee Portal (Project Café USA 2026, data through October 2025) values the U.S. branded coffee shop segment at $58.5 billion across 45,227 outlets under 588 brands. That counts chains and franchises, not independent neighborhood cafés.
At the farm gate, the Coffee Barometer 2026 estimates around 12.5 million farming households produce the majority of the world's coffee, most on less than two hectares (about 80% of farms, roughly 60% of supply).
What do home brewing ratios and temperatures look like?
Surveys tell you which brewers people use. They don't tell you the ratios or water temperatures people brew with. For that you need recipe-level data, and that's the part we care about when we're dialing in at home.
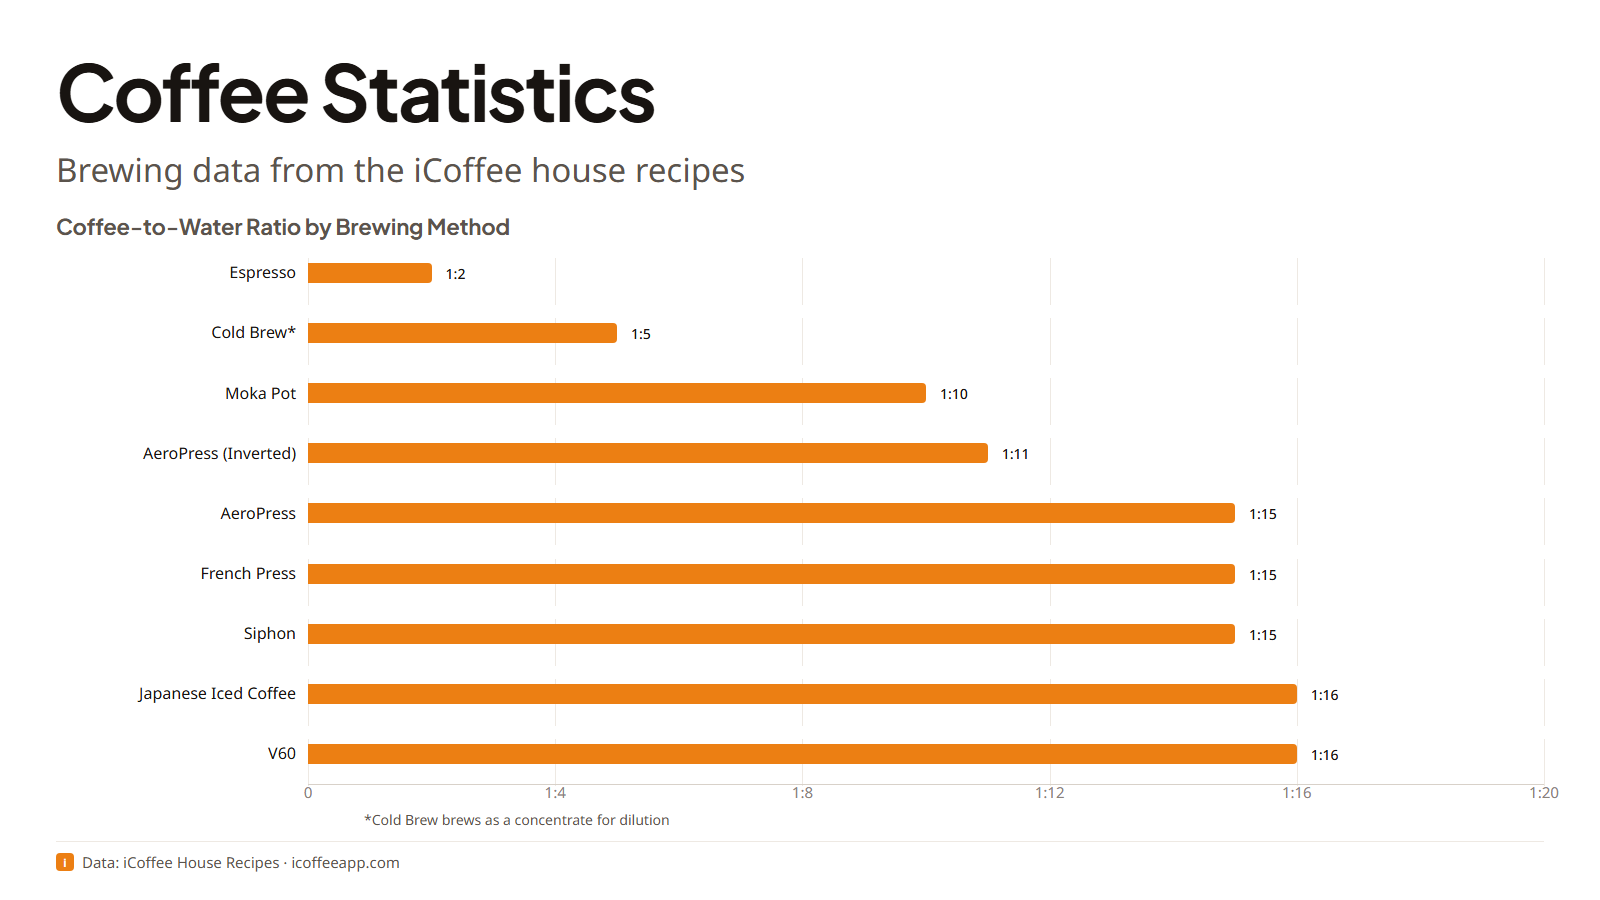
We publish tested house recipes for every major brew method (V60, French press, espresso, AeroPress, Moka pot, cold brew, and others). Aggregating those recipes by method gives a first-party picture of how ratio and temperature cluster across methods. These charts are first-party numbers from the iCoffee house recipes: tested, published brewing parameters, aggregated by method from our 2026 recipe set. You won't find this ratio and temperature breakdown in NCA or USDA releases; they complement the survey data above.
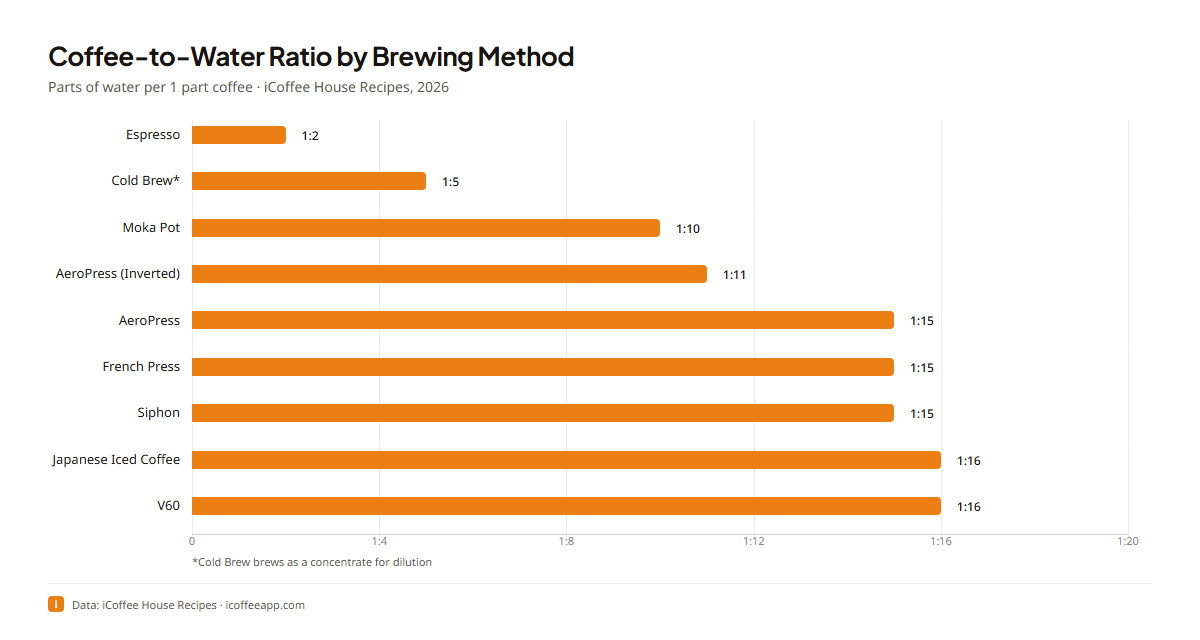
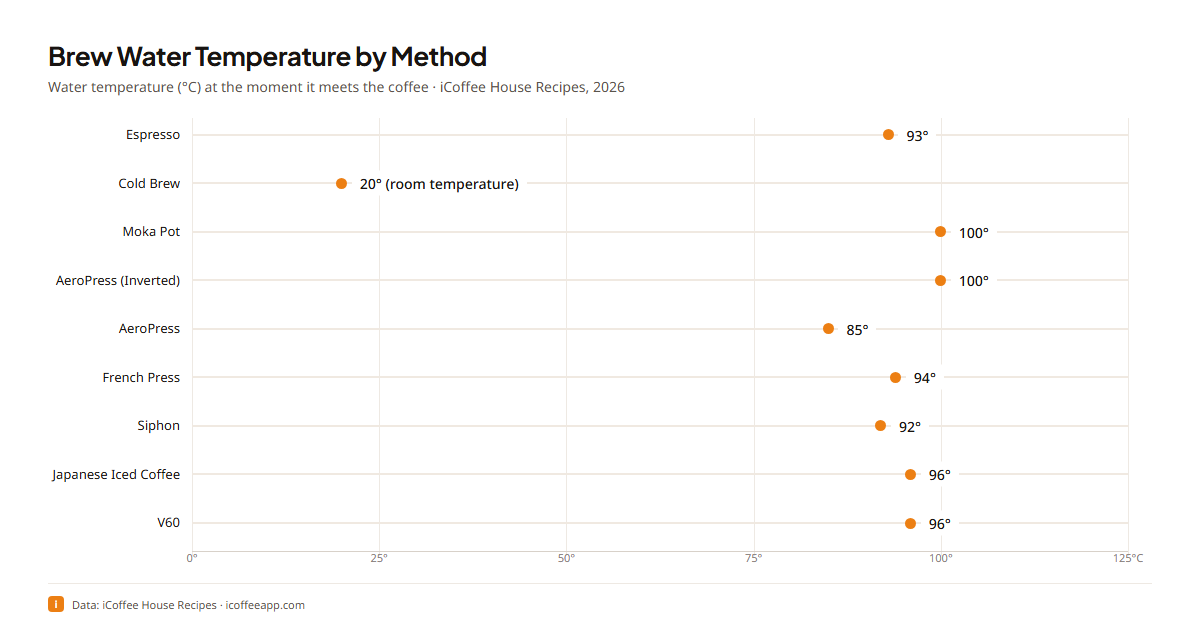
The spread matters more than any single method's number. Espresso and Moka pot recipes target concentrated outputs, so their ratios sit tighter than pour-over or French press. Methods that finish in under a minute need hotter water; cold brew trades heat for hours of contact time. A V60 and a French press landing in different ratio bands isn't a mistake. They're different drinks.
If you brew across multiple methods and want to compare whether your V60 yesterday used the same effective ratio as your French press last week, logging dose, yield, and water temperature per brew is the practical way to spot drift. That is the workflow iCoffee was built around: one place to record what changed between cups so the next adjustment is data, not guesswork. For diagnosing cups that still taste off after you fix ratio and temperature, see why coffee tastes bitter, sour, or weak.
How many Americans drink coffee every day?
The headline U.S. consumption figure comes from the National Coffee Association's National Coffee Data Trends (NCDT). In the Spring 2026 wave, 66% reported drinking coffee in the past day. That share has held at 66% across Spring 2025, Fall 2025, and Spring 2026; the past-week figure in the same release is 73%.
Extrapolating from the survey, the NCA puts the weekly drinking population at nearly 195 million American adults. That's an estimate, not a census, but it is the standard industry estimate for "how many Americans drink coffee."
The past-day rate has climbed over two decades. The Spring 2024 NCDT reported 67% of adults had coffee in the past day, a 20-year high and up 37% since 2004 (when the past-day rate was 49%). Subsequent waves settled at 66%, but the long-run direction is still up.
Among people who drank coffee yesterday, the Spring 2025 NCDT found an average of 3 cups per day (the Fall 2025 wave rounds this to "nearly 3 cups"; Daily Coffee News reports 2.8 cups in Spring 2026). That average is per past-day coffee drinker, not per U.S. adult overall.
Coffee consumption statistics: who drinks what, and where?
Specialty coffee keeps gaining share
"Specialty" in NCDT surveys means espresso-based drinks plus premium non-espresso coffee, not the SCA quality-graded definition.
On a past-day basis, the Spring 2025 NCDT found 46% of U.S. adults had specialty coffee yesterday, up from 39% in 2020. The Fall 2025 NCDT pushed the past-day specialty rate to a record 48%, up from 37% in 2021 (traditional coffee was 41% each day in that wave).
The Spring 2025 specialty report marked the first NCDT reading where specialty (46% past day) surpassed traditional coffee (42% past day), a 14-year high for specialty.
On a past-week basis (a different denominator; do not compare directly to past-day figures above), the Spring 2026 NCDT reports 58% of U.S. adults drank specialty coffee in the past week, up 9.4% since 2022. Espresso-based beverages specifically rose from 40% past week in 2022 to 45% past week in 2026 in the same survey (lattes 21%, straight espresso 20%).
Age and daily drinking
Daily drinking still skews older. The Spring 2024 NCDT reported past-day rates of 73% among adults 60+, 70% for ages 25–39, 69% for 40–59, and 47% for 18–24 (flat year over year). Younger adults drink coffee less often, but when they do, it's more likely to be a specialty drink.
At home, at breakfast, and through the drive-through
Home preparation dominates. Of past-day drinkers in the Spring 2025 NCDT, 71% had coffee prepared at home only (16% out of home only, 13% both). That is up from 63% in 2020 and hasn't come back down since the pandemic.
The Fall 2025 NCDT adds the where and when: 85% of past-day drinkers had coffee at breakfast, and 82% drank coffee at home. Note that "drank at home" (82%) is not the same metric as "prepared at home only" (71%).
When Americans buy coffee out, the drive-through and the app keep winning. Among coffee drinkers who purchased out of home in the past week, 59% used a drive-through in Fall 2025 (an all-time high, up 9% since 2024) and 36% ordered via app, per the NCA Fall 2025 release.
What are the most popular coffee brewing methods?
Equipment-share data below is from the Fall 2025 NCDT. Percentages are among past-day coffee drinkers, not all adults.
Brewing method shares among past-day coffee drinkers · NCA Fall 2025 NCDT
| Method | Share of past-day drinkers |
|---|---|
| Drip brewer | 38% |
| Single-cup brewer | 23% |
| Espresso machine | 11% |
| Ready-to-drink (RTD) | 19% |
Drip has led every NCDT wave, and at 38% it's still the default American brewer (French press vs drip coffee compares it with the most common alternative). We're not betting against it anytime soon. Single-cup brewers come second. Espresso machines are the closest free proxy for home espresso gear; detailed brewer-ownership tables sit behind the NCA's paid report.
RTD coffee reached 19% of past-day drinkers in Fall 2025, up from 9% in 2021, per the Fall 2025 NCDT release. That covers bottled and canned coffee, not just cold brew.
Cold drinks spike in summer. The Fall 2025 survey found cold, iced, or frozen drinks were 31% of all U.S. coffee consumed, up from 23% in the January 2025 survey. Treat that as a seasonal peak, not a year-round average. We read that as a durable shift, not a fad: the January number was already 23%.
NCA does not break out pour-over, French press, or AeroPress in its free releases. For ratio and temperature data down to the exact recipe, see the iCoffee charts in the section above.
Key coffee statistics at a glance
Selected statistics · verify base and year before quoting
| Statistic | Value | Source / base |
|---|---|---|
| U.S. adults who drank coffee yesterday | 66% | NCA Spring 2026 NCDT · past day |
| Americans who drink coffee weekly | ~195 million | NCA Spring 2026 NCDT · projection |
| Past-day drinkers: specialty coffee | 48% (Fall 2025) | NCA Fall 2025 NCDT · past day |
| Past-week drinkers: espresso-based beverages | 45% (up from 40% in 2022) | NCA Spring 2026 NCDT · past week |
| Drip brewer share among past-day drinkers | 38% | NCA Fall 2025 NCDT |
| At-home-only preparation (past-day drinkers) | 71% | NCA Spring 2025 NCDT |
| Global consumption forecast 2025/26 | 173.9 million bags | USDA FAS Dec 2025 · forecast |
| Global production forecast 2025/26 | 178.8 million bags | USDA FAS Dec 2025 · forecast |
| ICO composite price | 256.05 ¢/lb (May 2026) | ICO Coffee Market Report |
| U.S. coffee economic impact | $343.2 billion (2022) | NCA / Technomic 2023 study |
| U.S. branded coffee shop market | $58.5B · 45,227 outlets | World Coffee Portal 2026 |
| Global coffee-farming households | ~12.5 million | Coffee Barometer 2026 |
Get the data
Every number behind these charts is free to download and reuse with credit; the data files are licensed under CC BY 4.0. Browse the Coffee Brewing Data page, or grab the CSV and JSON files straight from the GitHub repository. The files update whenever our published recipes change.
How to embed our brewing charts (with attribution)
You're welcome to republish either chart, as long as you link back to this page (full terms on our image license page). Copy the HTML below into your CMS or article source.
Ratio chart:
<a href="https://icoffeeapp.com/en/learn/coffee-statistics" title="Coffee Statistics | iCoffee">
  <img
    src="https://icoffeeapp.com/images/data/brew-ratio-by-method-en.png"
    alt="Coffee-to-water ratio by brewing method (iCoffee house recipes)"
    width="1200"
    height="640"
    loading="lazy"
  />
</a>
<p>
  Source:
  <a href="https://icoffeeapp.com/en/learn/coffee-statistics">Coffee Statistics | iCoffee</a>
  (data: iCoffee house recipes)
</p>
Temperature chart:
<a href="https://icoffeeapp.com/en/learn/coffee-statistics" title="Coffee Statistics | iCoffee">
  <img
    src="https://icoffeeapp.com/images/data/brew-temp-by-method-en.png"
    alt="Brew water temperature by method (iCoffee house recipes)"
    width="1200"
    height="640"
    loading="lazy"
  />
</a>
<p>
  Source:
  <a href="https://icoffeeapp.com/en/learn/coffee-statistics">Coffee Statistics | iCoffee</a>
  (data: iCoffee house recipes)
</p>
About the author
Vanessa Simões
Co-founder of iCoffee
Make your next cup count.
iCoffee is the app that helps you brew better coffee at home, every day.
Get the appdownloadKeep reading
AeroPress vs Espresso Machine: Which One Is Right for You?
The AeroPress costs $40. An espresso machine costs $200 to $2,000. Here is what you get for the difference, and which one makes sense for your kitchen.

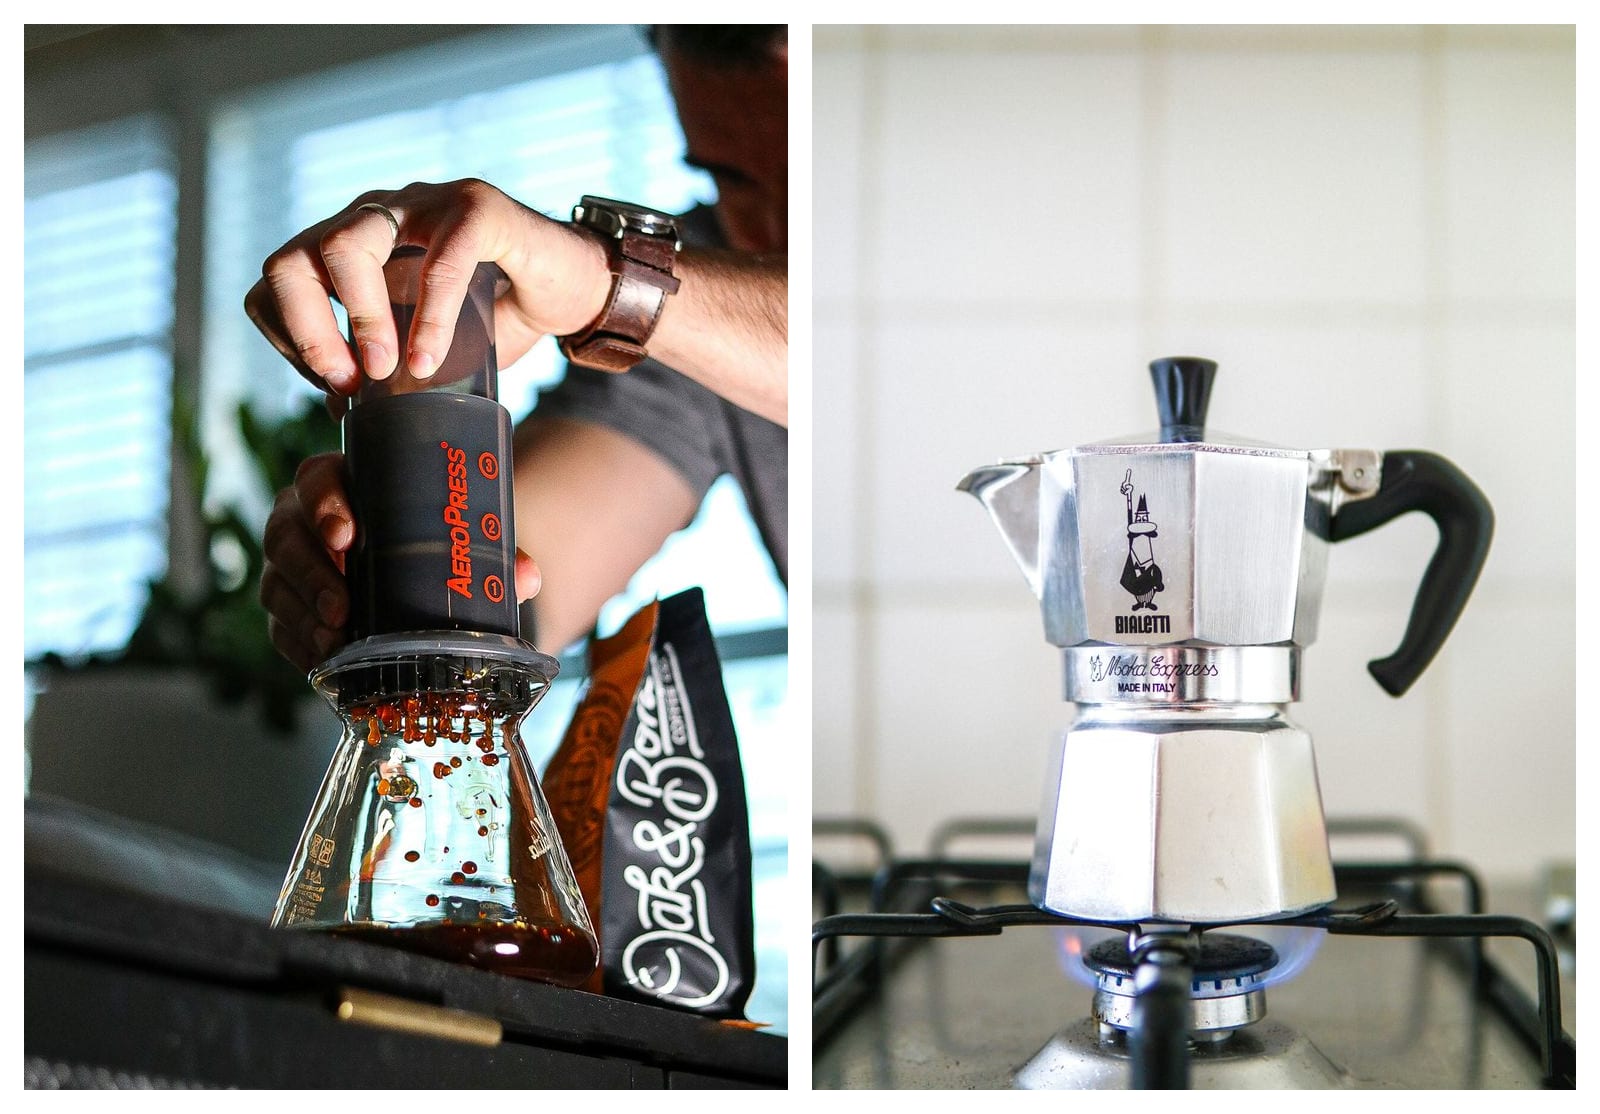
AeroPress vs Moka Pot: Which One Should You Buy?
Two compact brewers, two very different cups. What separates the AeroPress and the Moka Pot on flavor, effort, cost, and who each one is actually built for.
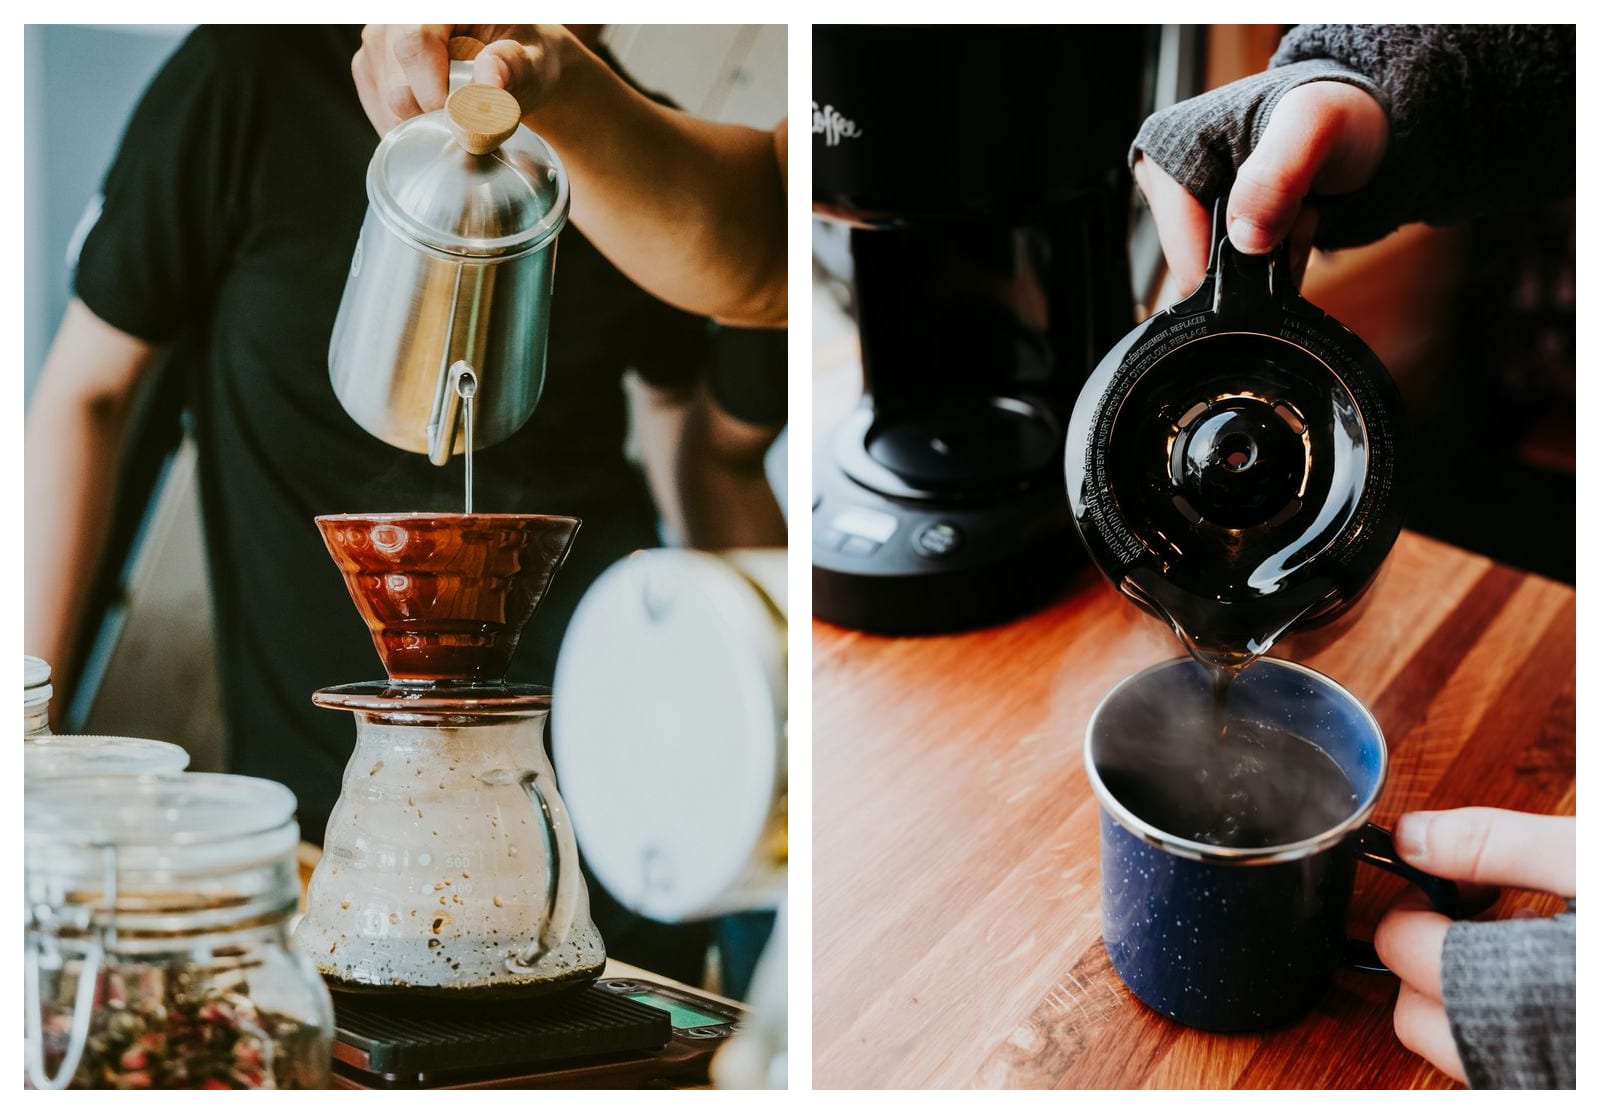
Pour Over vs Drip Coffee: Is the Upgrade Worth It?
A pour over gives you the temperature, the pour and the grind to adjust. A drip machine gives you a button. Which one suits you, on flavor, effort and cost.
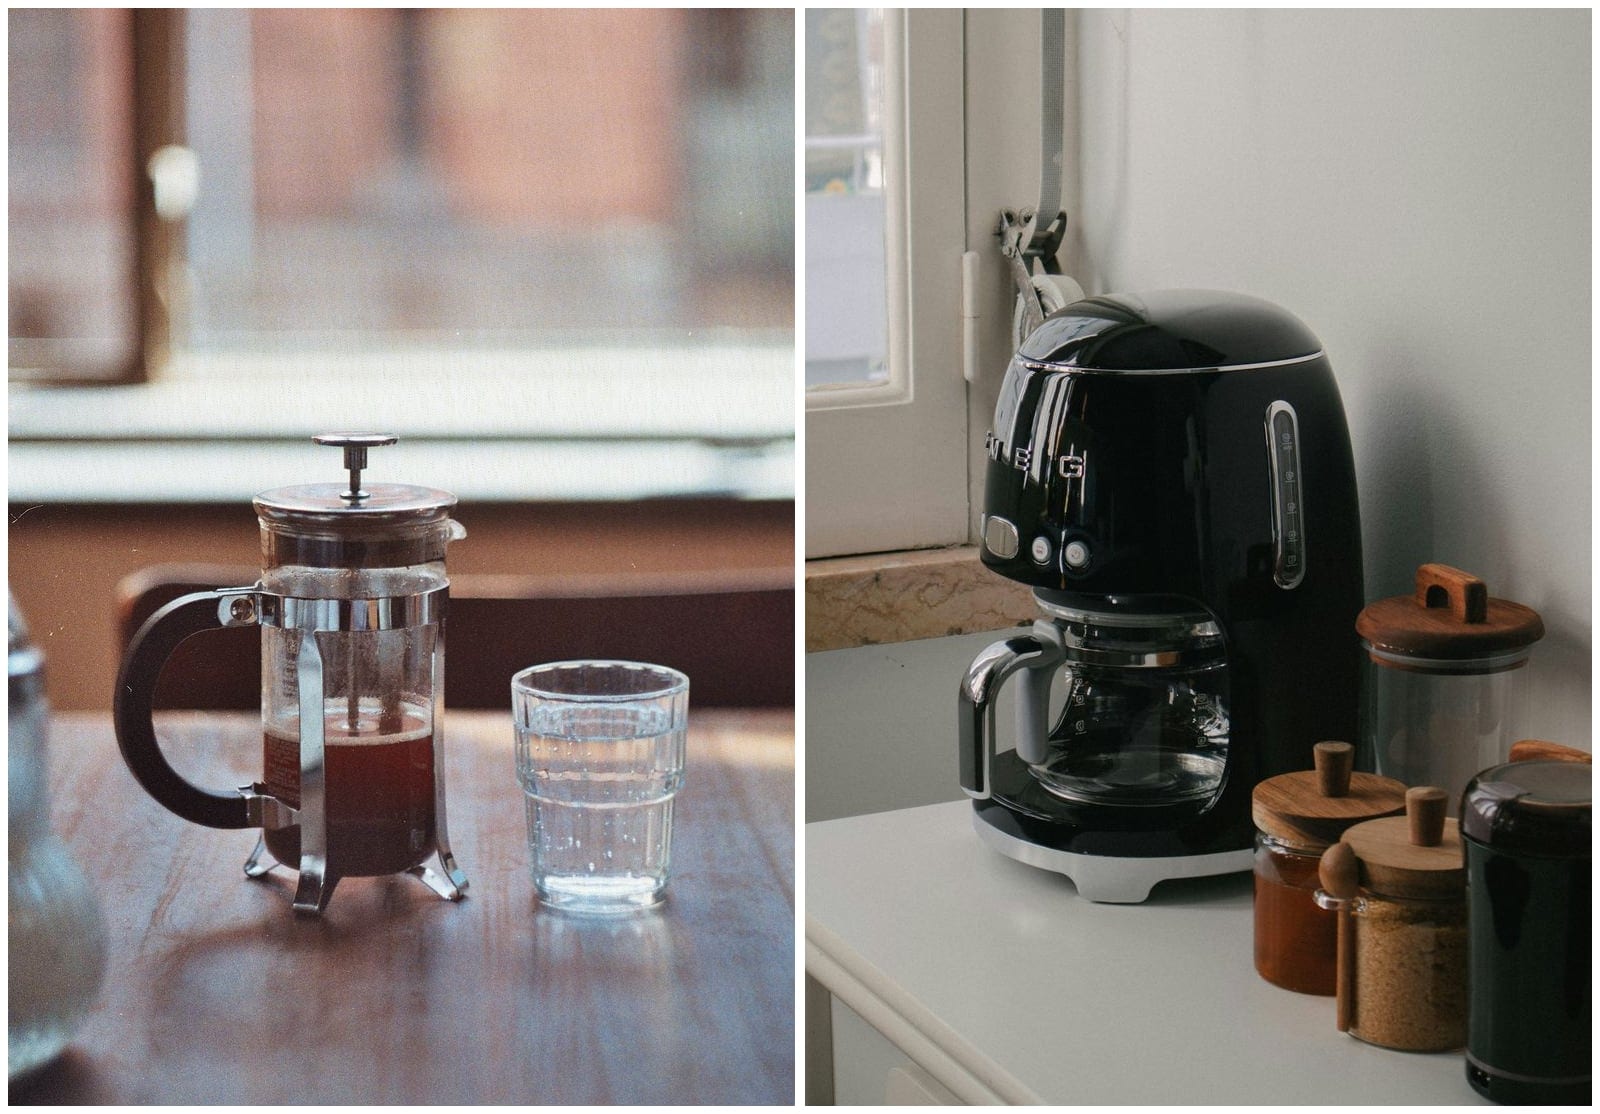
French Press vs Drip Coffee: Which One Should You Use?
Drip machine or French press: the cup, the effort, the cost and the honest trade-offs compared, plus a clear recommendation for each kind of home brewer.